Getting Started
Figure 1
To run the access test
1. visit https://broad.io/cb-python-access-test
2. click “Copy to Drive” and create your own copy of
Python_workshop_data_access_test.ipynb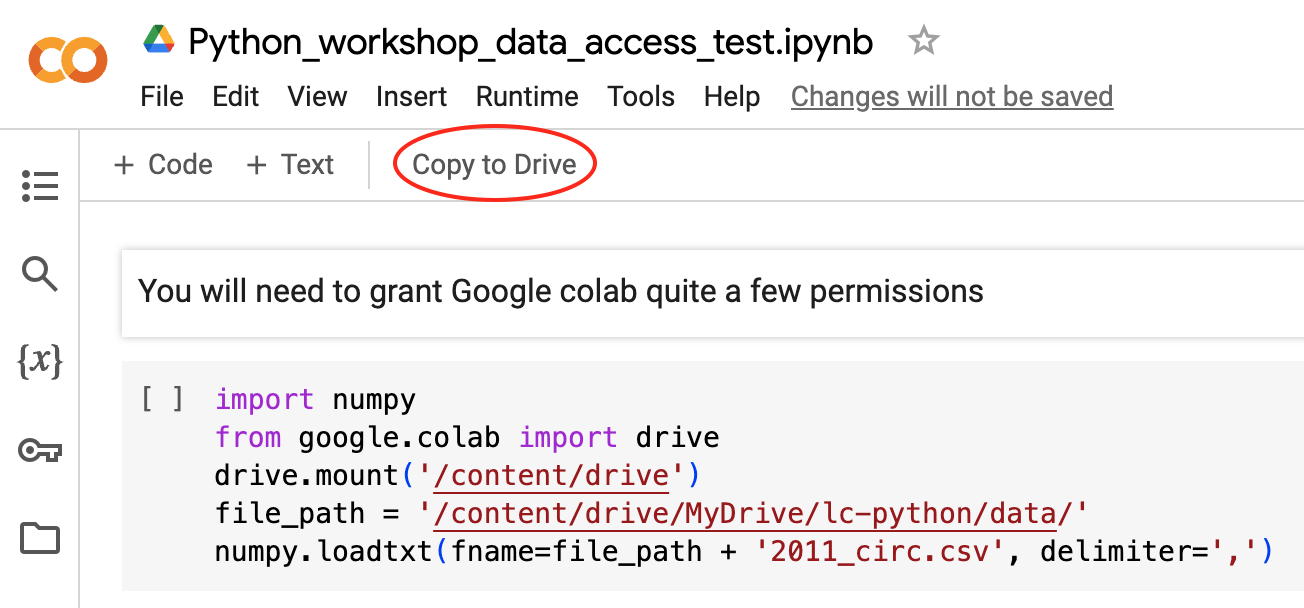
Figure 2
If you see this dialog box, click “Connect to Google Drive” 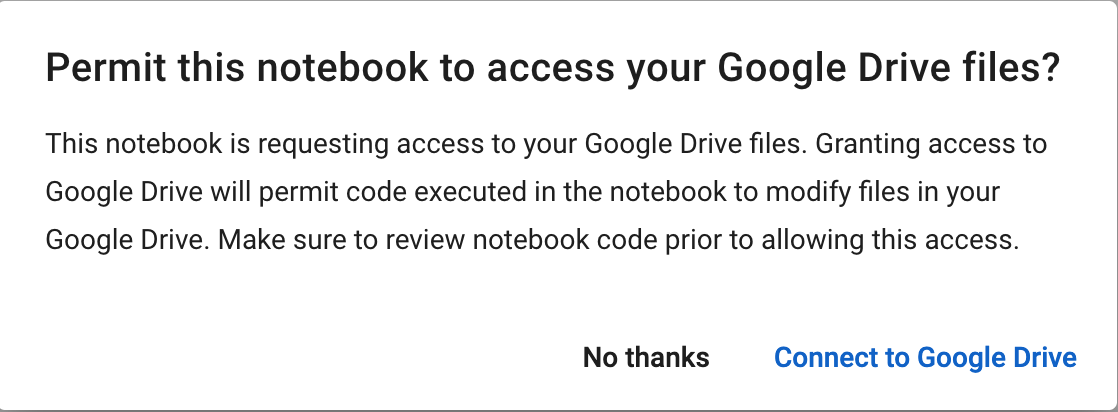
Figure 3
Authorize access for the google account you’re using for this
workshop. There will be several prompts to grant access. 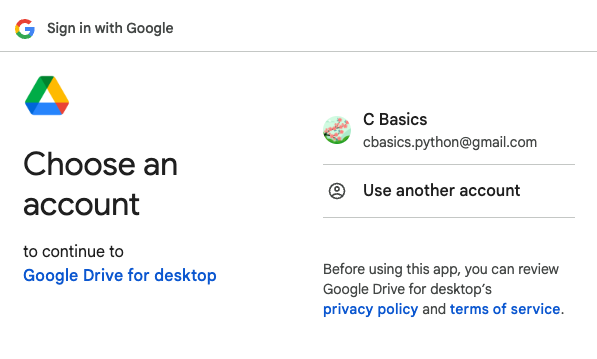
Figure 4
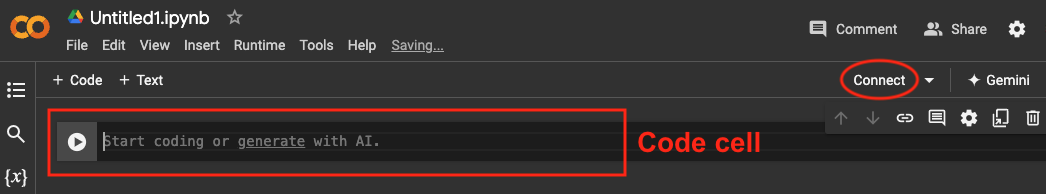
Once access has been granted, go back to the access test
notebook, click the ▶️ symbol on the left hand side of the first code
cell. You’ve successfully loaded data if you see a dataframe appear
beneath the code cell 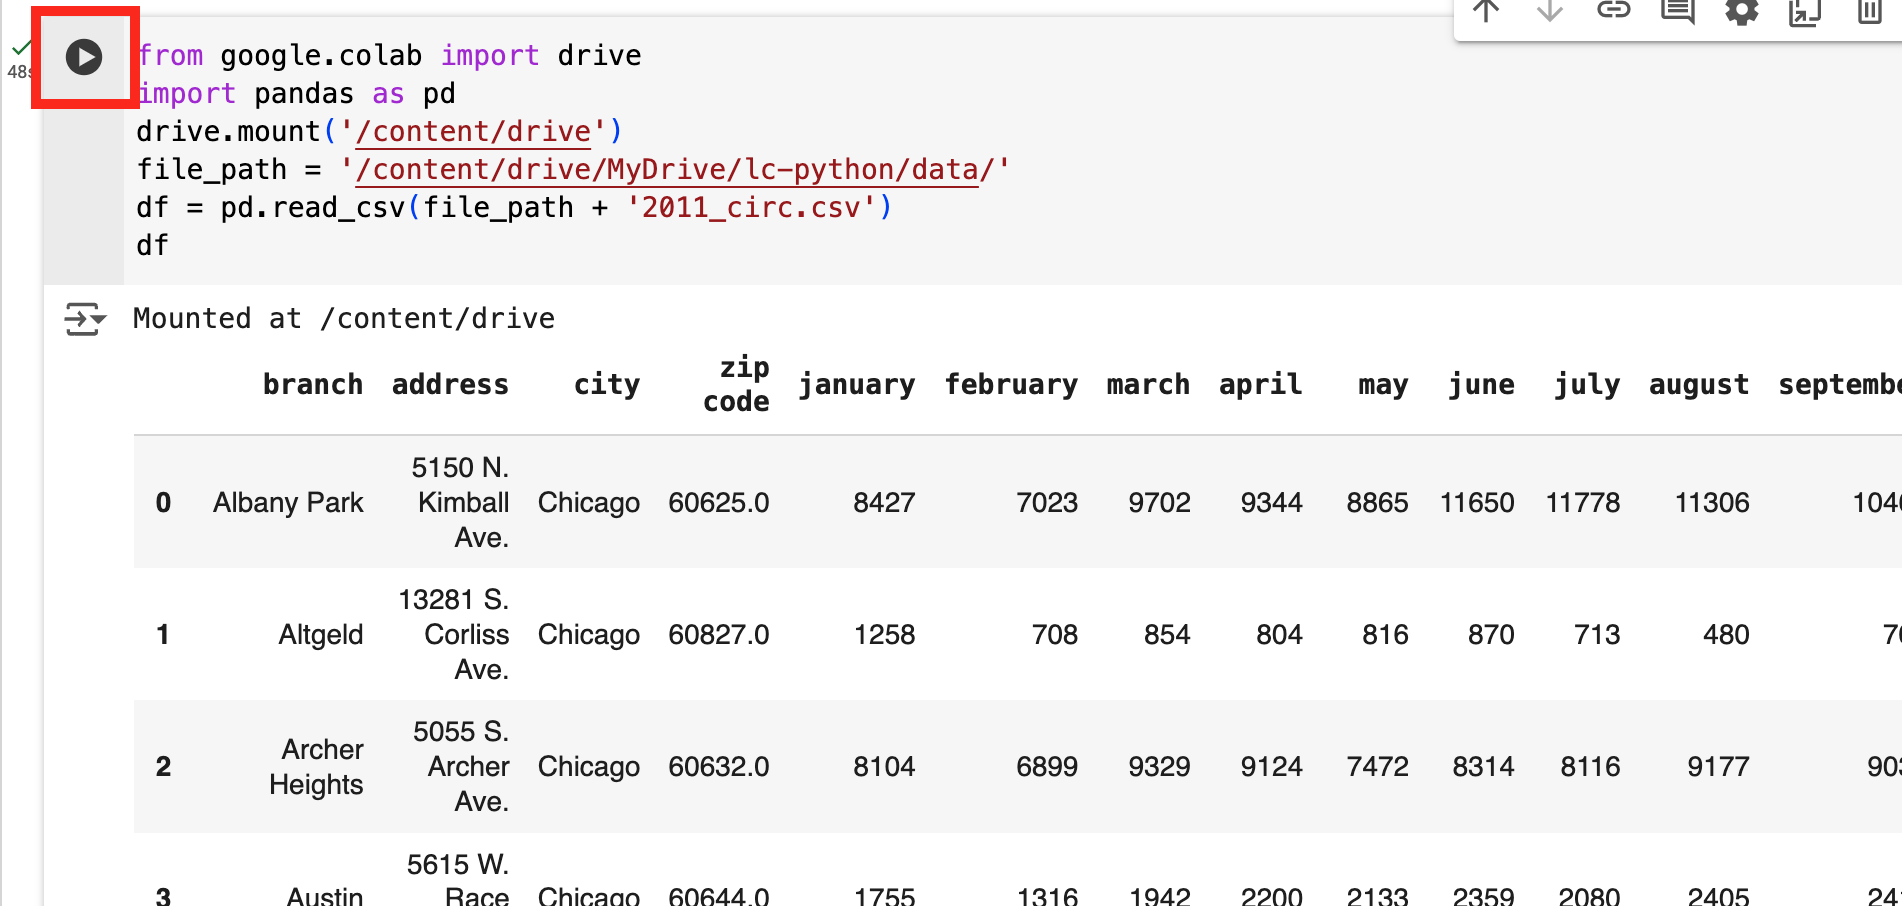
Figure 5
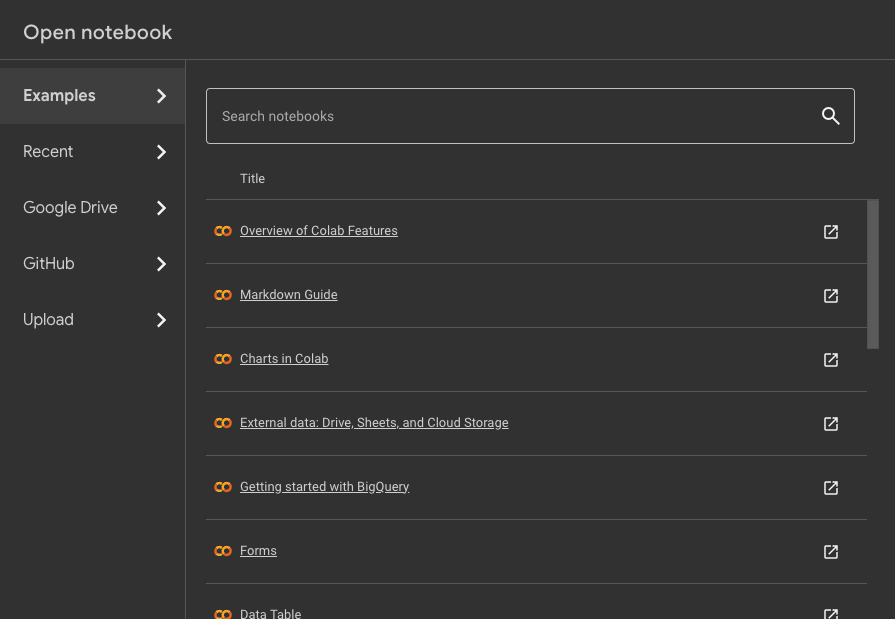
Figure 6
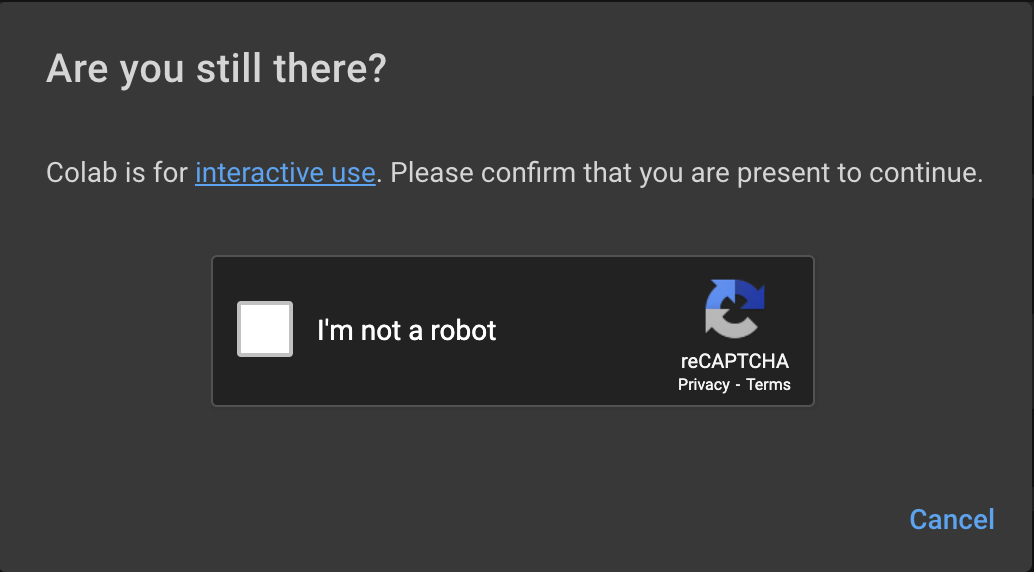
Figure 7
Variables and Types
Lists
Built-in Functions and Help
Libraries & Pandas
For Loops
Figure 1
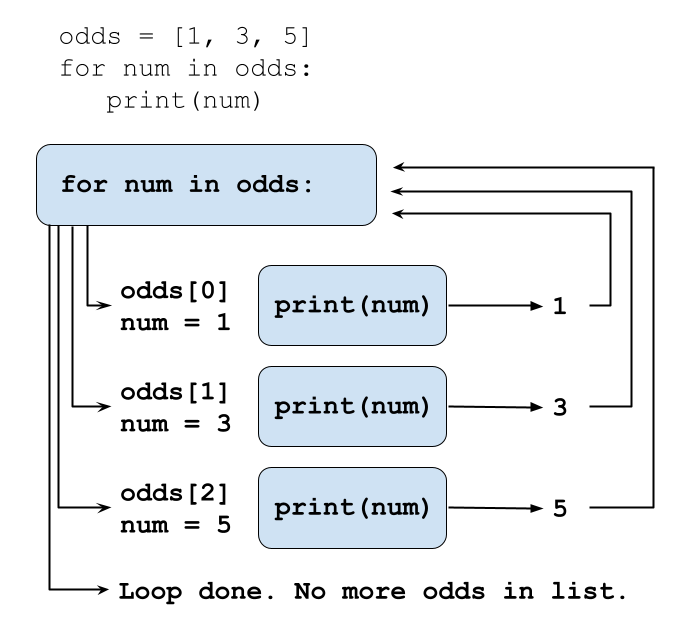
Looping Over Data Sets
Using Pandas
Conditionals
Writing Functions
Tidy Data with Pandas
Figure 1
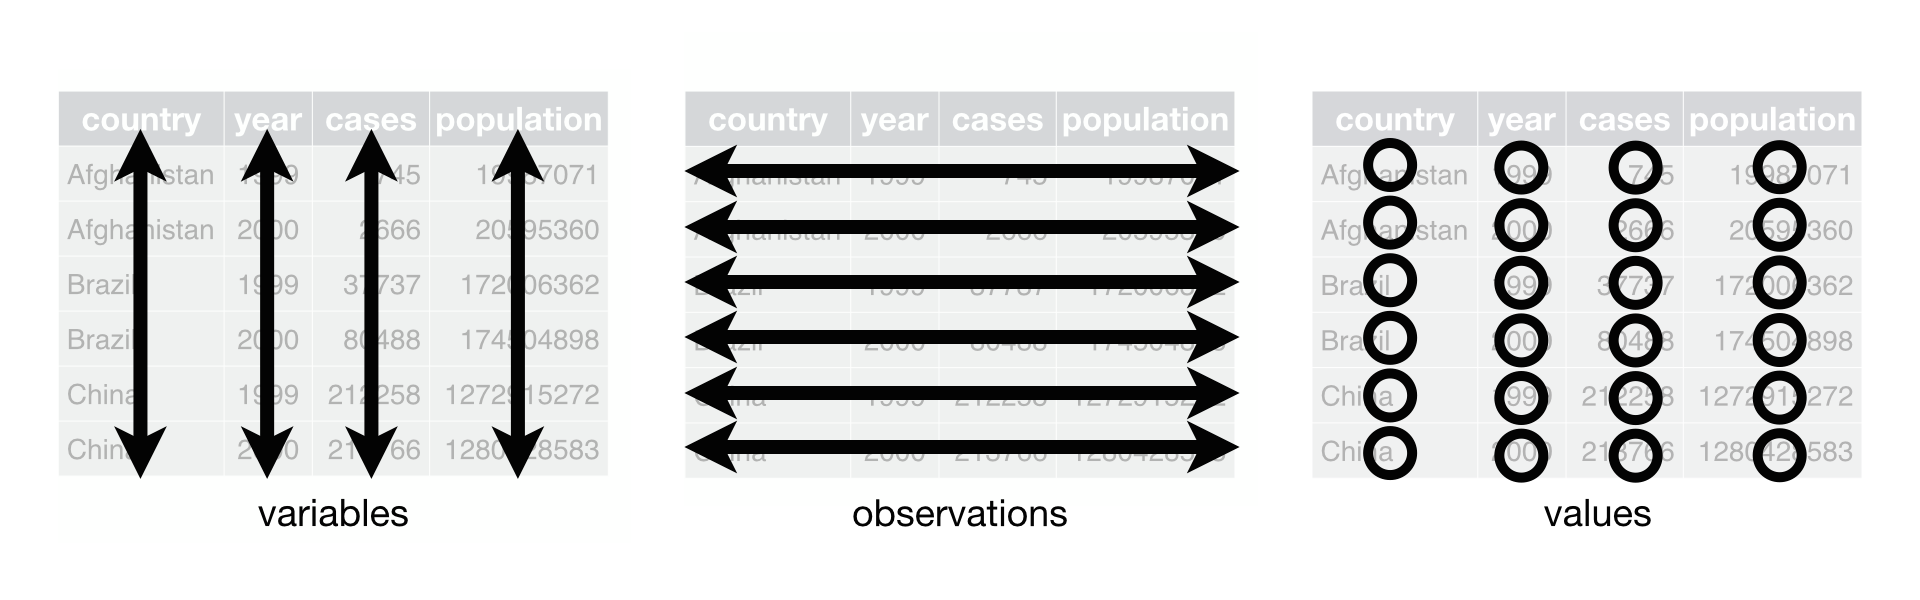
Tidy Data
Data Visualisation
Figure 1
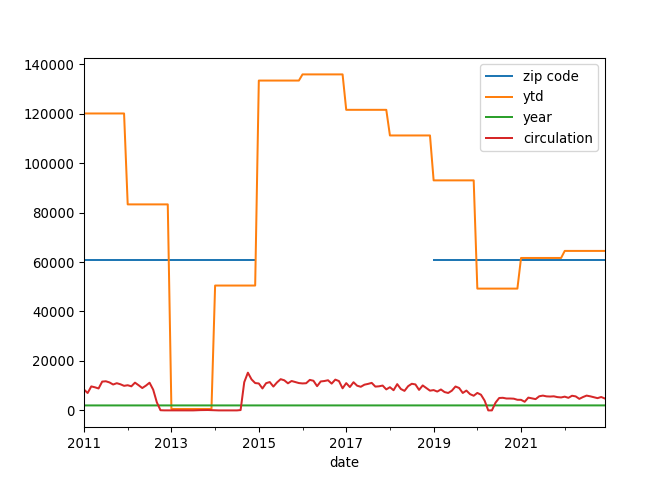
Figure 2
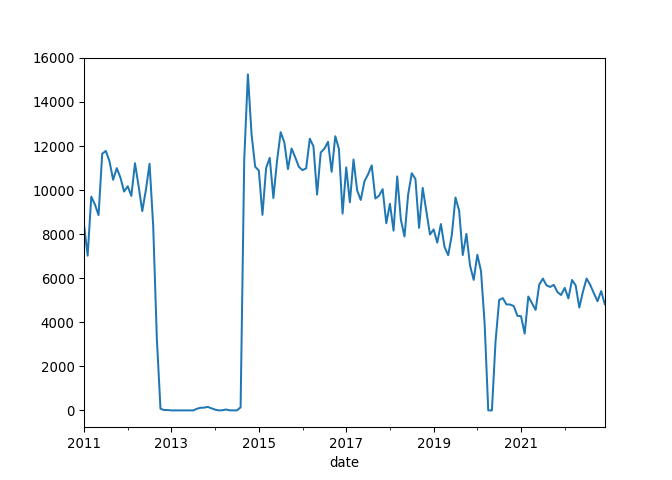
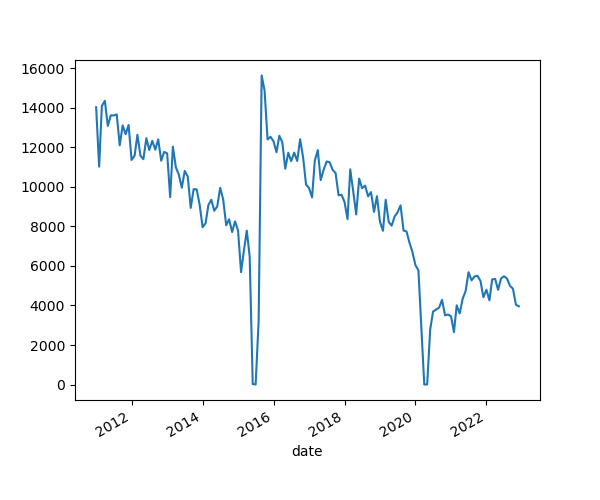
Figure 3
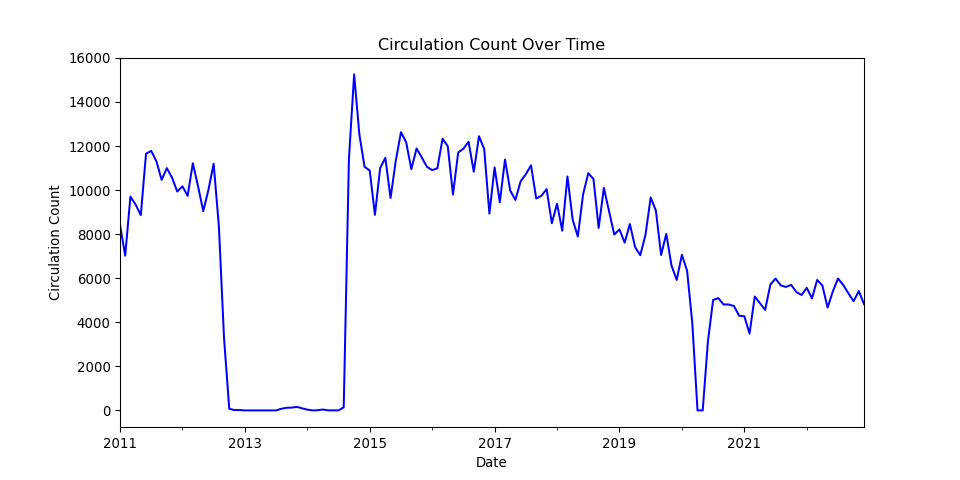
Figure 4
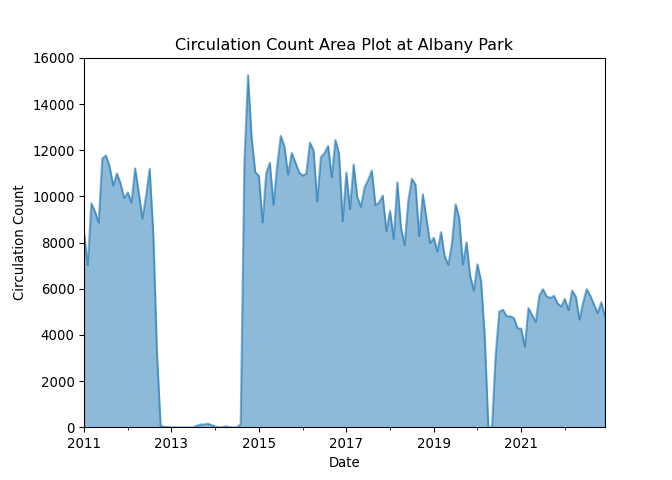
Figure 5
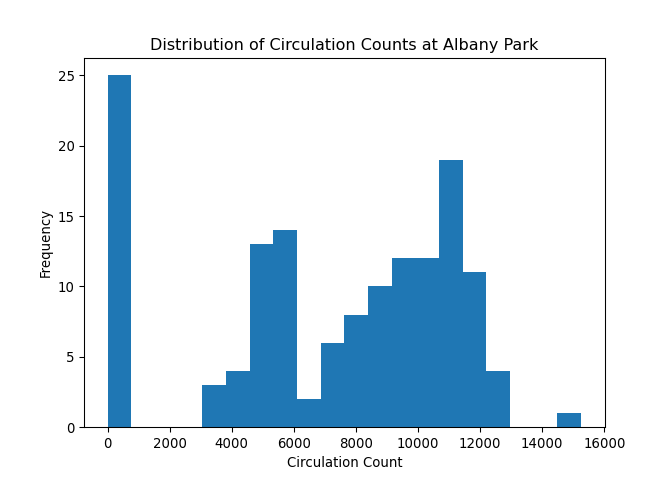
Figure 6
Chinatown plot
Figure 7
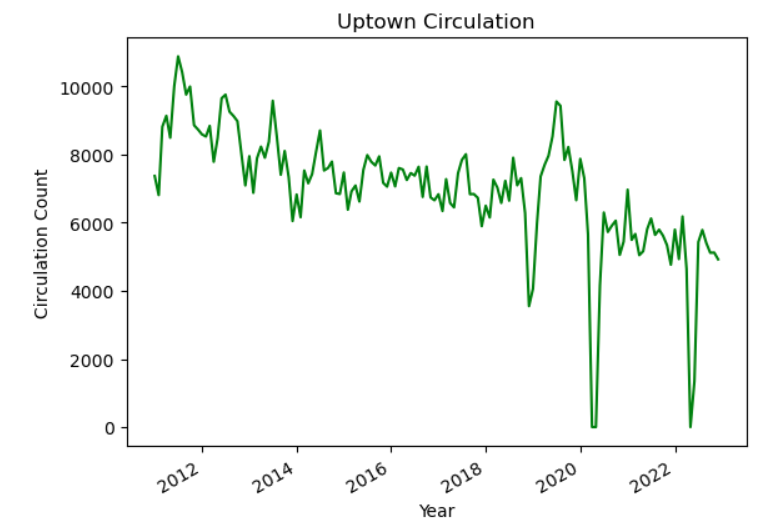
Uptown plot
Figure 8
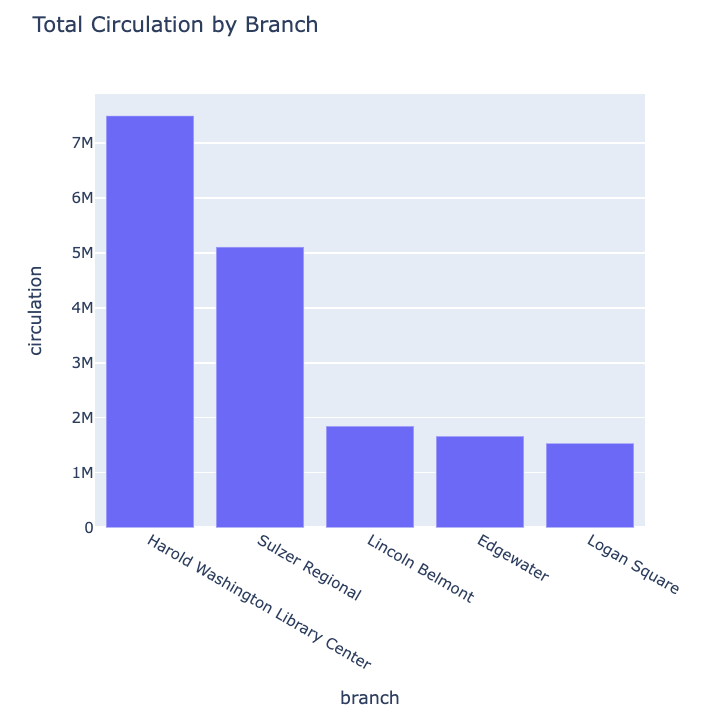
Top five circulation branches